Mechanical behavior of meso- and micro-porous open cell foams
Three-dimensional assembly comprised from 1D and 2D materials provide ultra-small porous structures beneficial for thermo-mechanical and electro-mechanical coupled applications. Porosity dependent characteristics are monitored through transport studies. The facility includes thermo-mechanical measurements and mechanical deformation testing units. Micro and mesoporous foams are highly desirable for the lightweight impact absorbing systems in the microelectronic packaging industry. Carbon nanostructures based open cell foams like graphene and carbon nanotubes being multifunctional in nature can be exploited widely for their elastic behaviour. Graphene with large surface area and spring like recovery of carbon nanotubes open a great potential to be exploited in the research area of studying their mechanical behaviour.
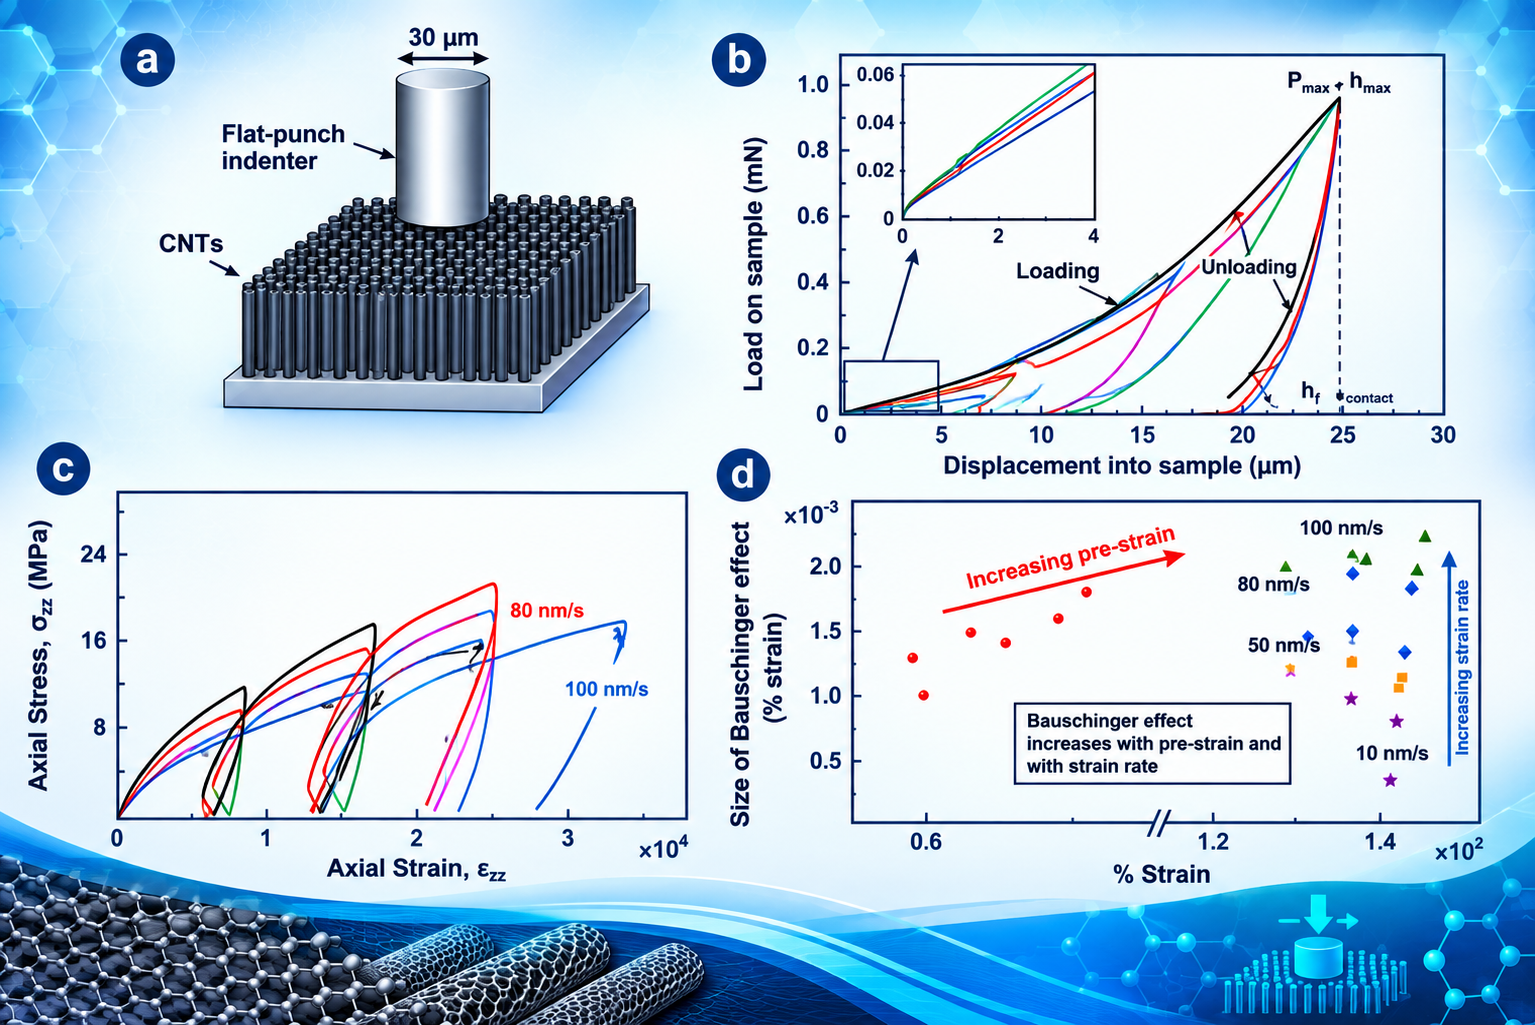
Strain Rate Effects in the Mechanical Response of Polymer-Anchored Carbon Nanotube Foams
Figure: Flat punch nanoindentation results. a) Schematic diagram showing the experimental set up. b) Load–displacement curves obtained at different loading rates. c) Stress–strain curves extrapolated by the indentation measurement at varying strain rates upon various loading/ unloading cycles showing the presence of a Baushinger-like effect. d) Dependence of the hysteresis loop amplitude on strain.
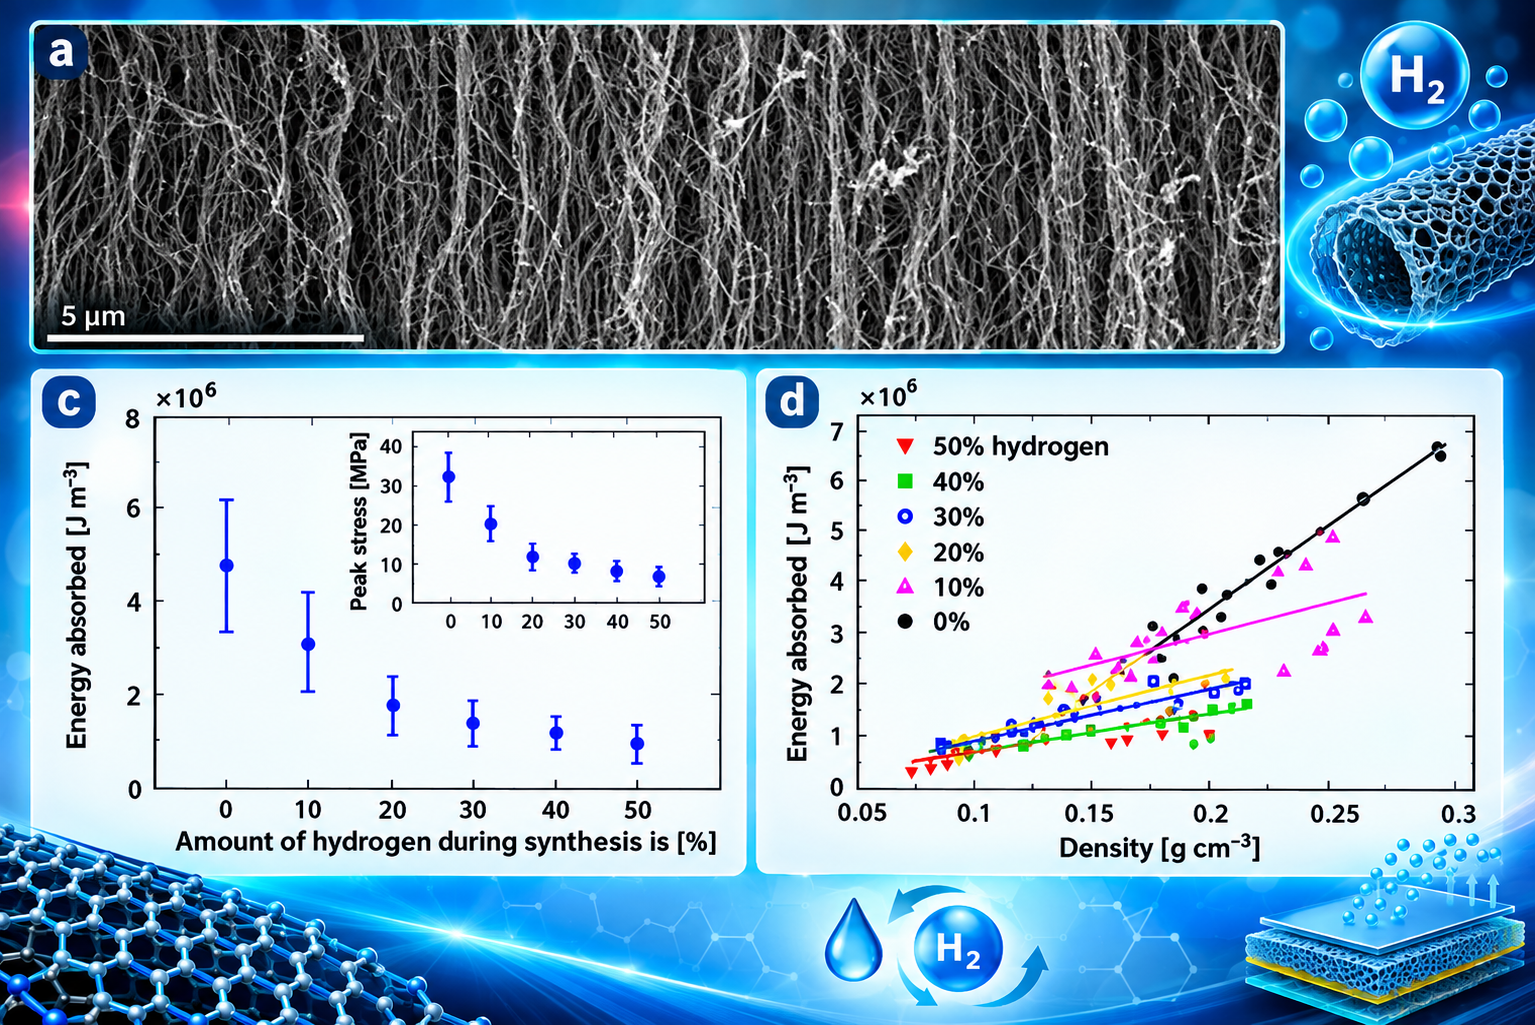
Tailoring the microstructure and mechanical properties of arrays of aligned multiwall carbon nanotubes by utilizing different hydrogen concentrations during synthesis
Figure: SEM image of a typical sample showing the mostly-aligned nature of VACNTs as synthesized. Average energy absorbed per unit volume calculated for the first compressive cycle for each hydrogen concentration. The inset shows the variation of the peak stress values obtained at maximum (0.8) strain as a function of the hydrogen concentration used during growth. Energy absorbed in the first compressive cycle plotted as a function of density for all concentrations of hydrogen.
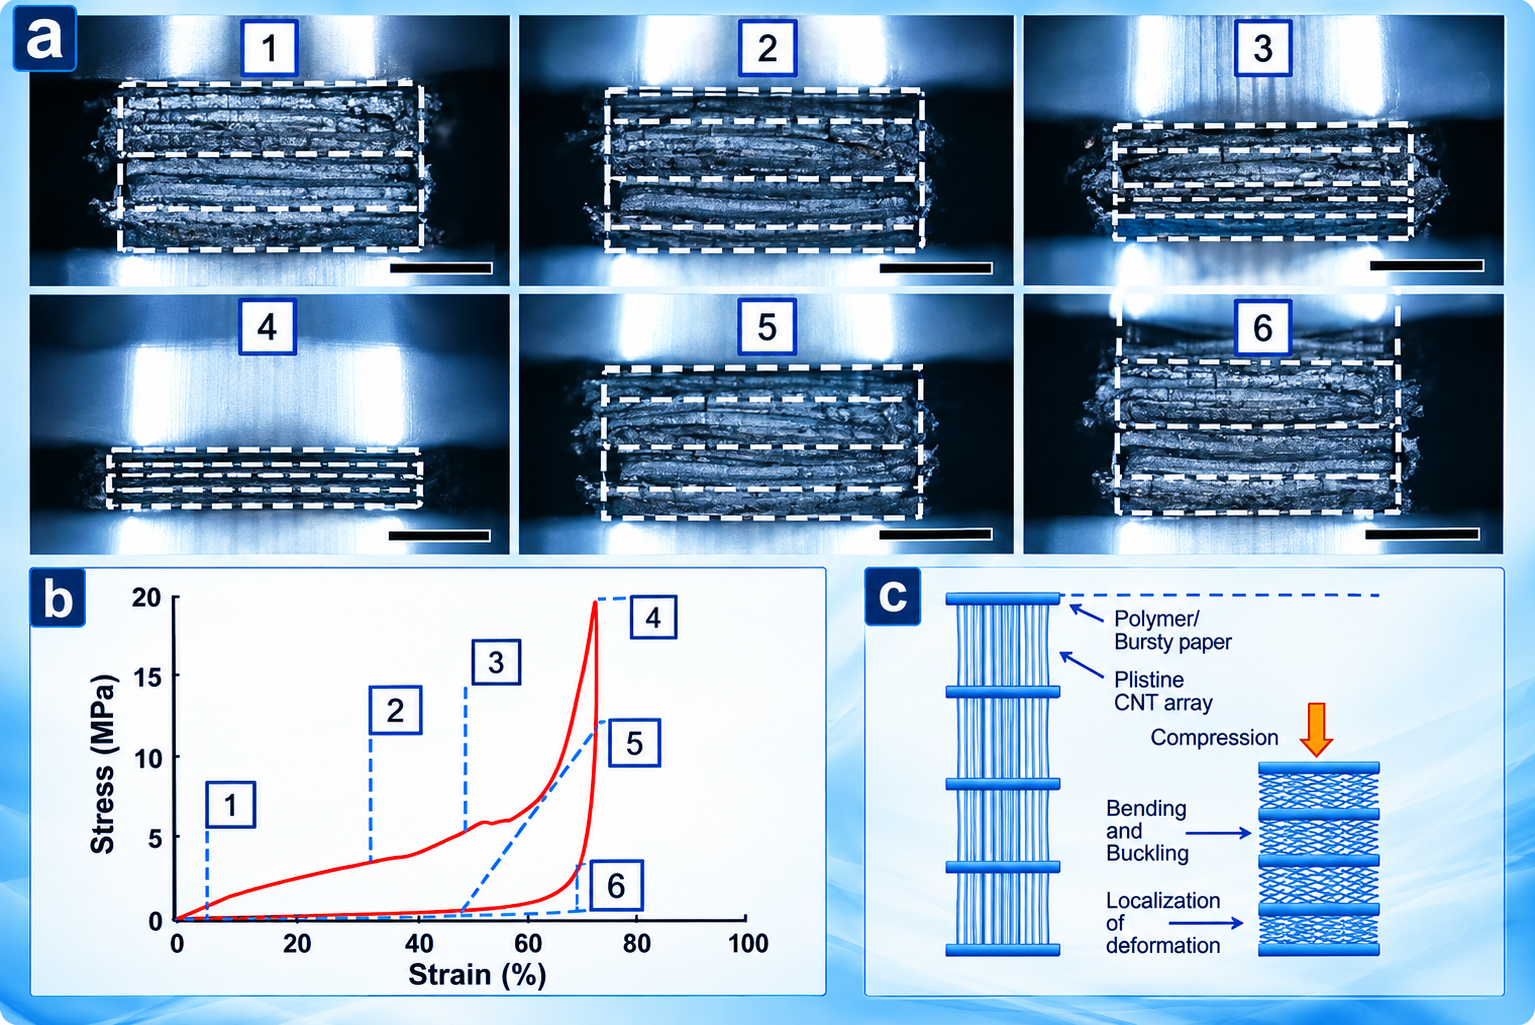
Synthesis and characterization of carbon nanotube-polymer multilayer structures
Figure: In situ visualization of the compressive deformation of a multilayer sample. (a) Digital snapshots of the deformed configuration of the four-layer structure corresponding to the different strain levels indicated in panel (b). The white lines show the position of polymer, which separates each CNT layer. (b) Stress-strain curve showing the different strain levels corresponding to the snapshots in panel (a). (c) Schematic diagram illustrating the localized deformation of the four-layer structure under compression.
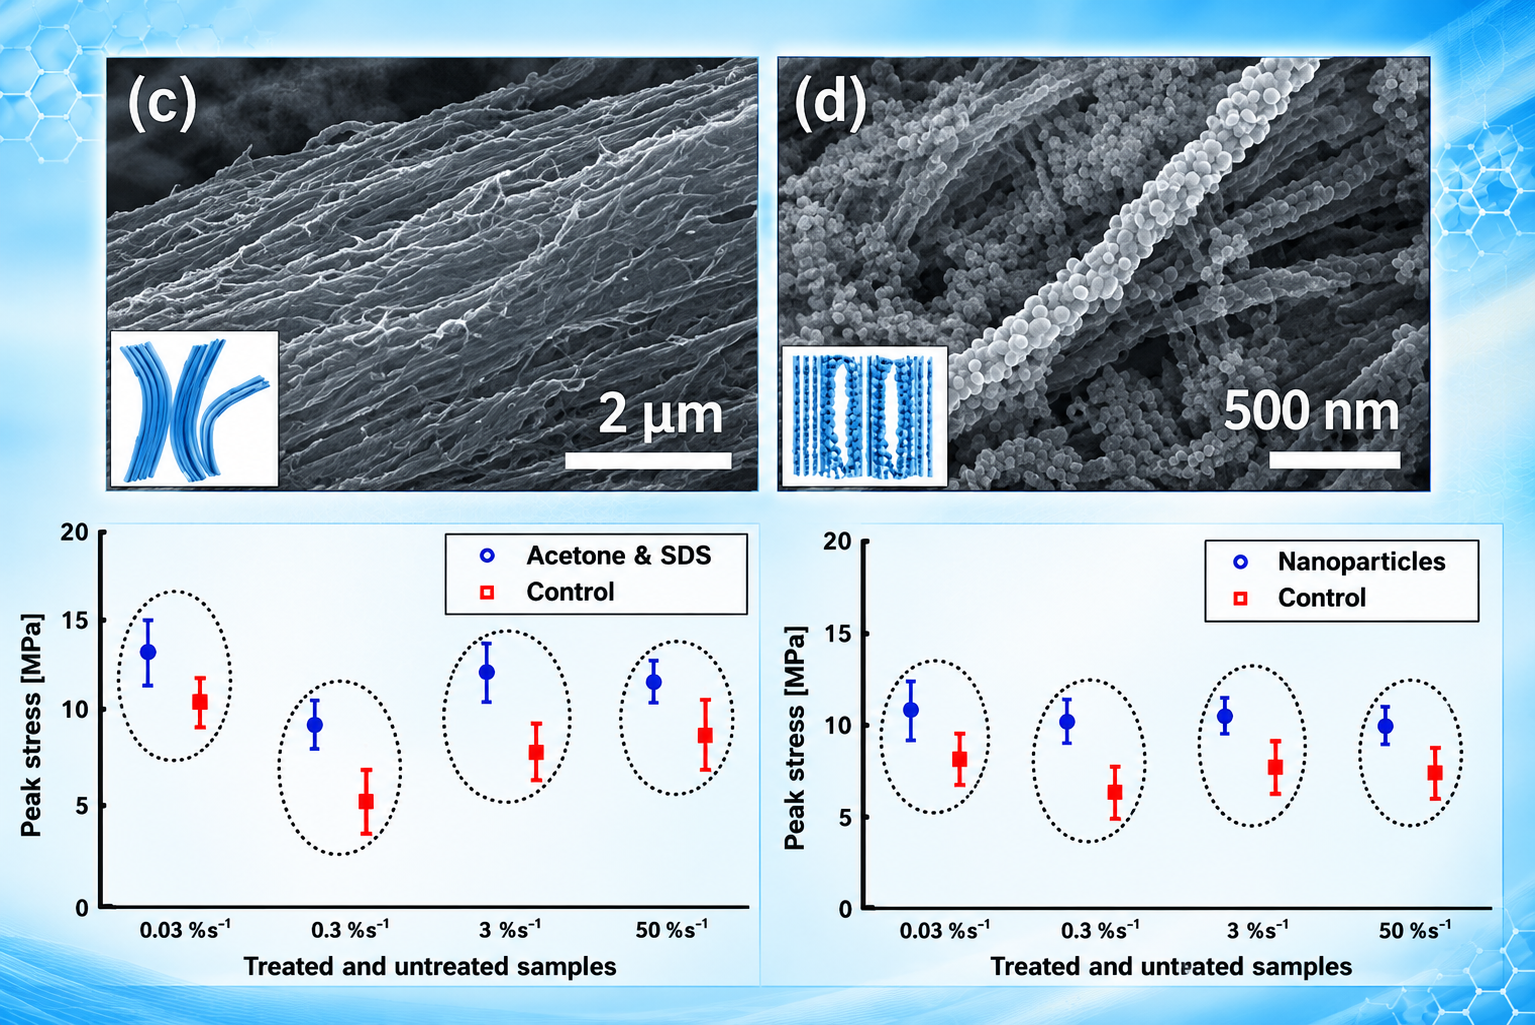
Effect of density variation and non-covalent functionalization on the compressive behavior of carbon nanotube arrays
Figure: Microstructure of a CNT sample treated with acetone and SDS surfactant; carbon nanotubes form dense bundles. (d) Microstructure of a CNT sample wetted with silica nanoparticles; after the drying process, nanoparticles adhere to the surface of individual carbon nanotubes. Comparison of the maximum value of compressive peak stress in samples wetted with surfactant (data points denoted by circles) and in freestanding, as-grown CNTs (control) (data points denoted by squares), at varying strain rates. Variation of measured peak stress as a function of strain rate. Data points shown by circles represent samples with nanoparticles, and squares represent the results obtained from the as-grown (control) samples.
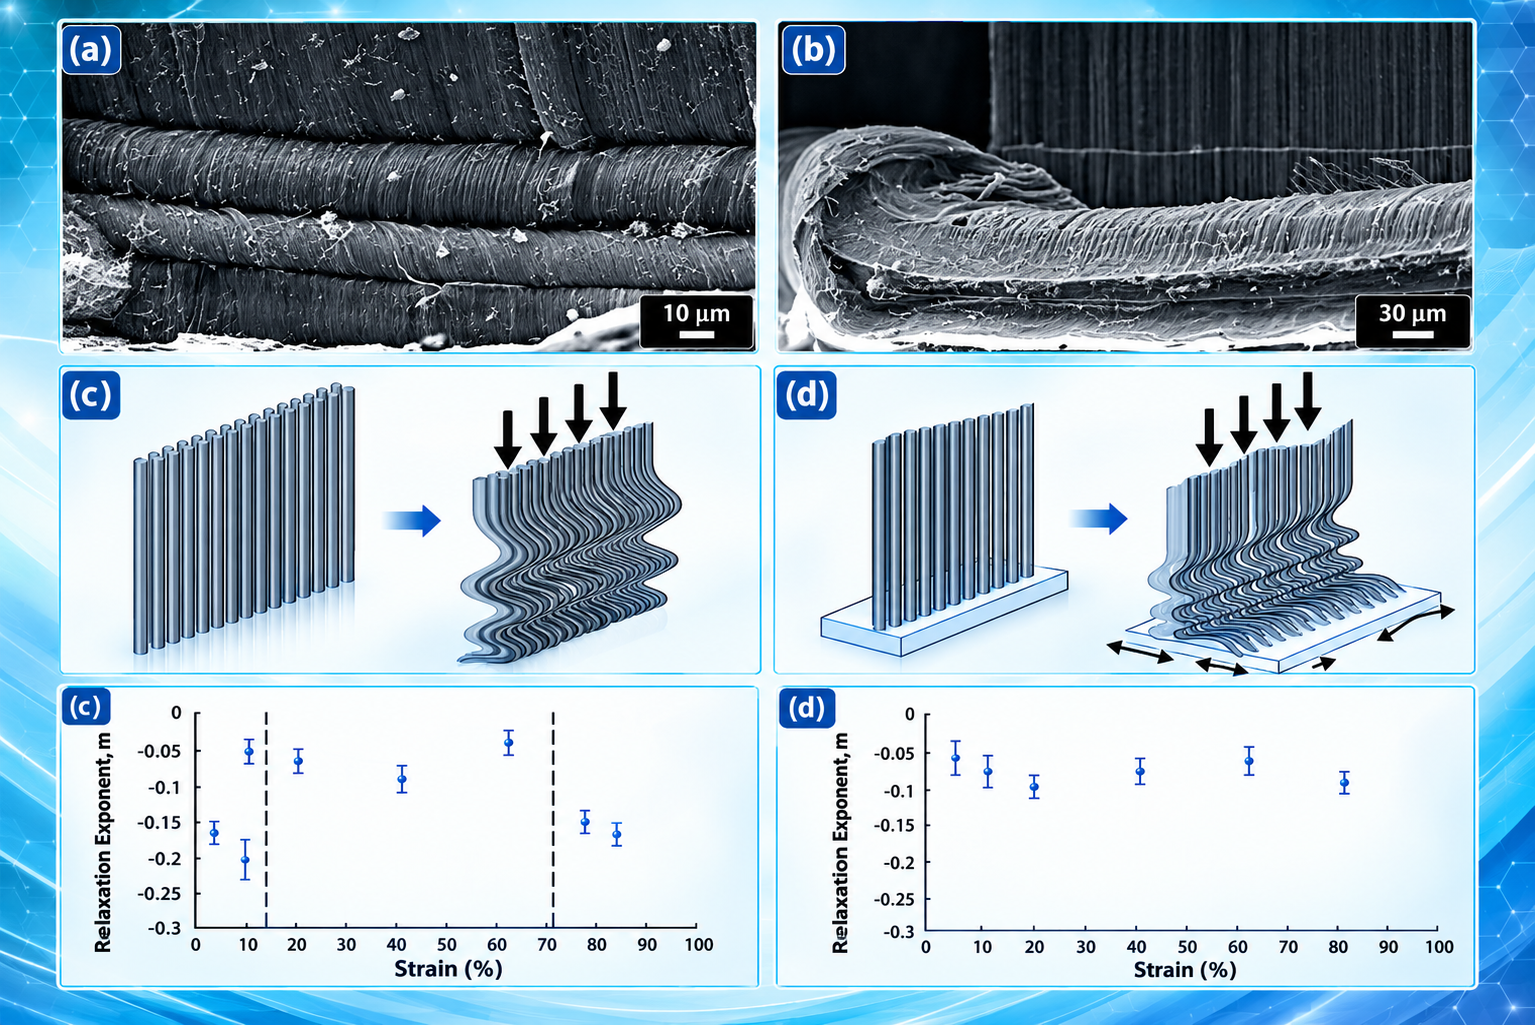
Nonlinear viscoelasticity of freestanding and polymer-anchored vertically aligned carbon nanotube foams
Figure: Relaxation exponent m vs strain for (c) freestanding (mF) and (d) double-anchored (mA) CNT forests.
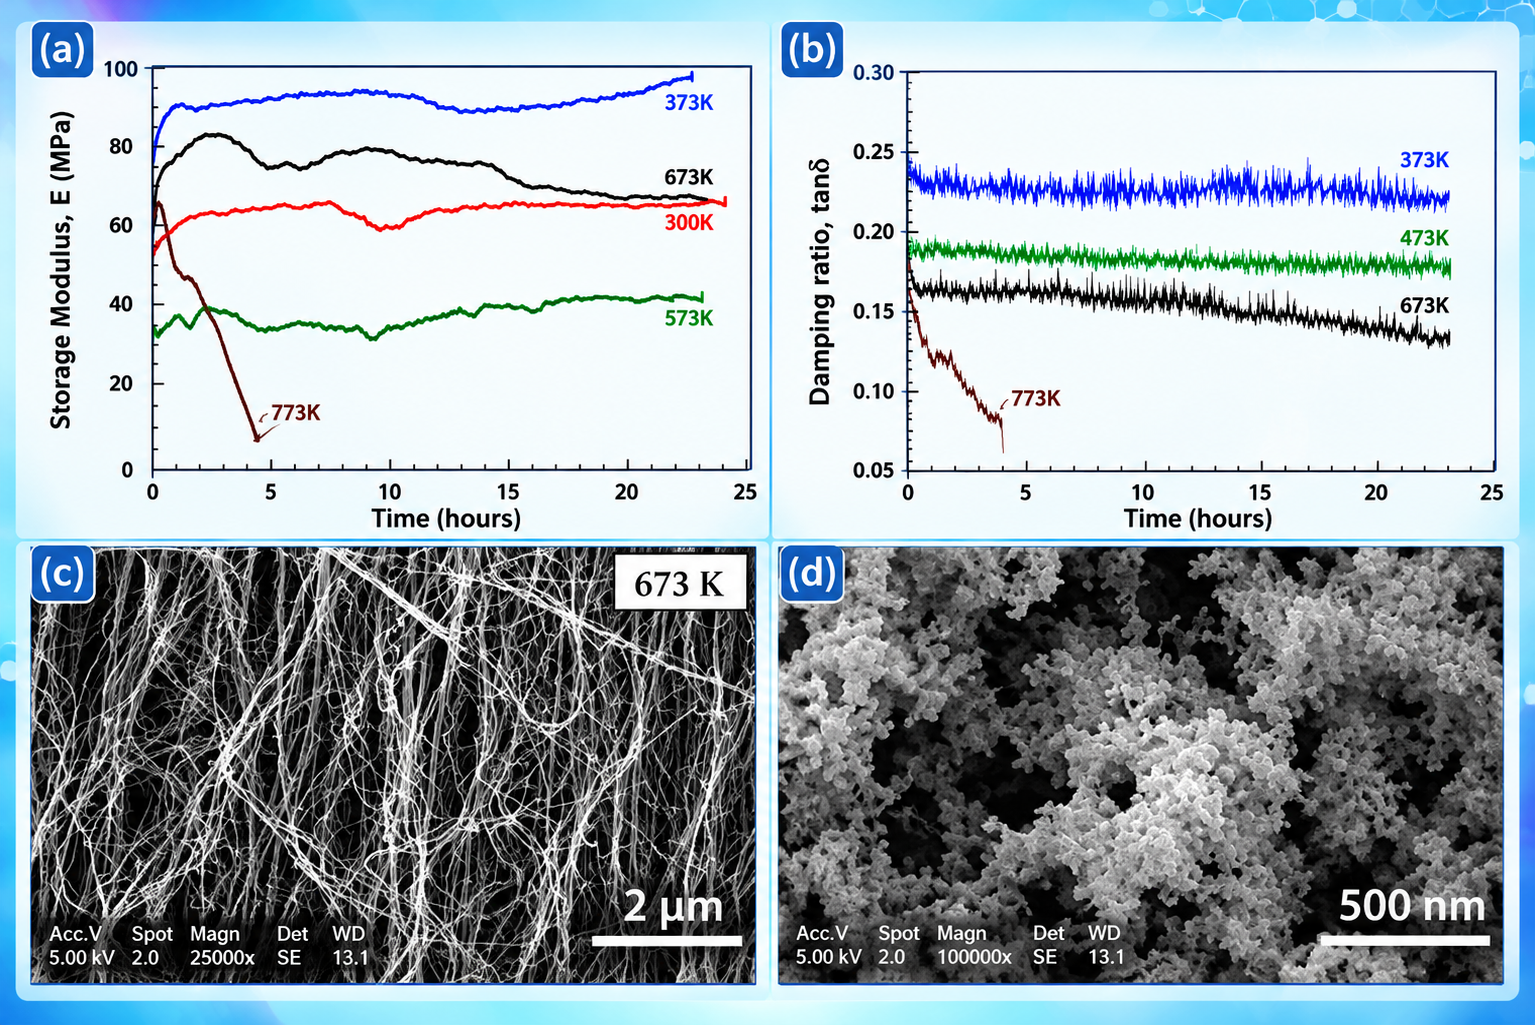
Thermo-mechanical stability of a cellular assembly of carbon nanotubes in air
Figure: Results of the DMA tests showing the variations of (a) storage modulus, E, and (b) damping ratio, tand with time. SEM images of the CNT mat subjected to DMA at 673, and 773 K.
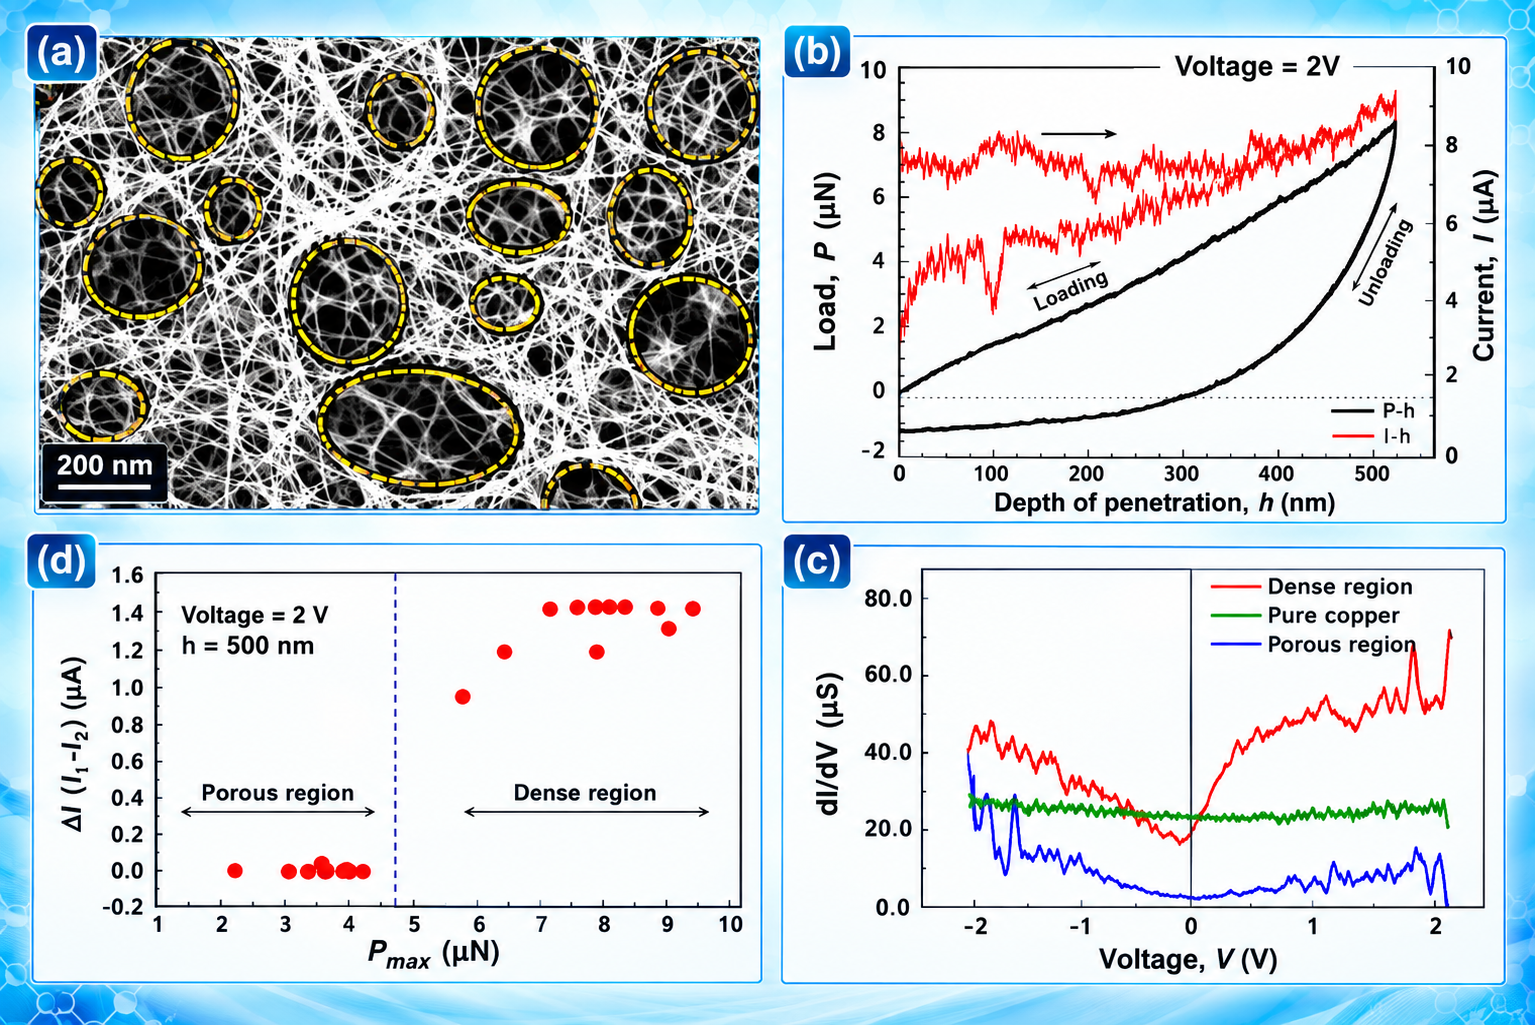
Mechanical and electrical contact resistance characteristics of a cellular assembly of carbon nanotubes
Figure: Scanning electron micrograph showing the cellular structure of CNTs. Structural porosity is indicated with circles. Load, P, and current, I, are plotted against depth of penetration, h, obtained from the dense and the porous regions of the CNT structures, respectively. Difference in initial and final currents before and after loading (at zero penetration depth) plotted against the peak load employed for the indentation study.
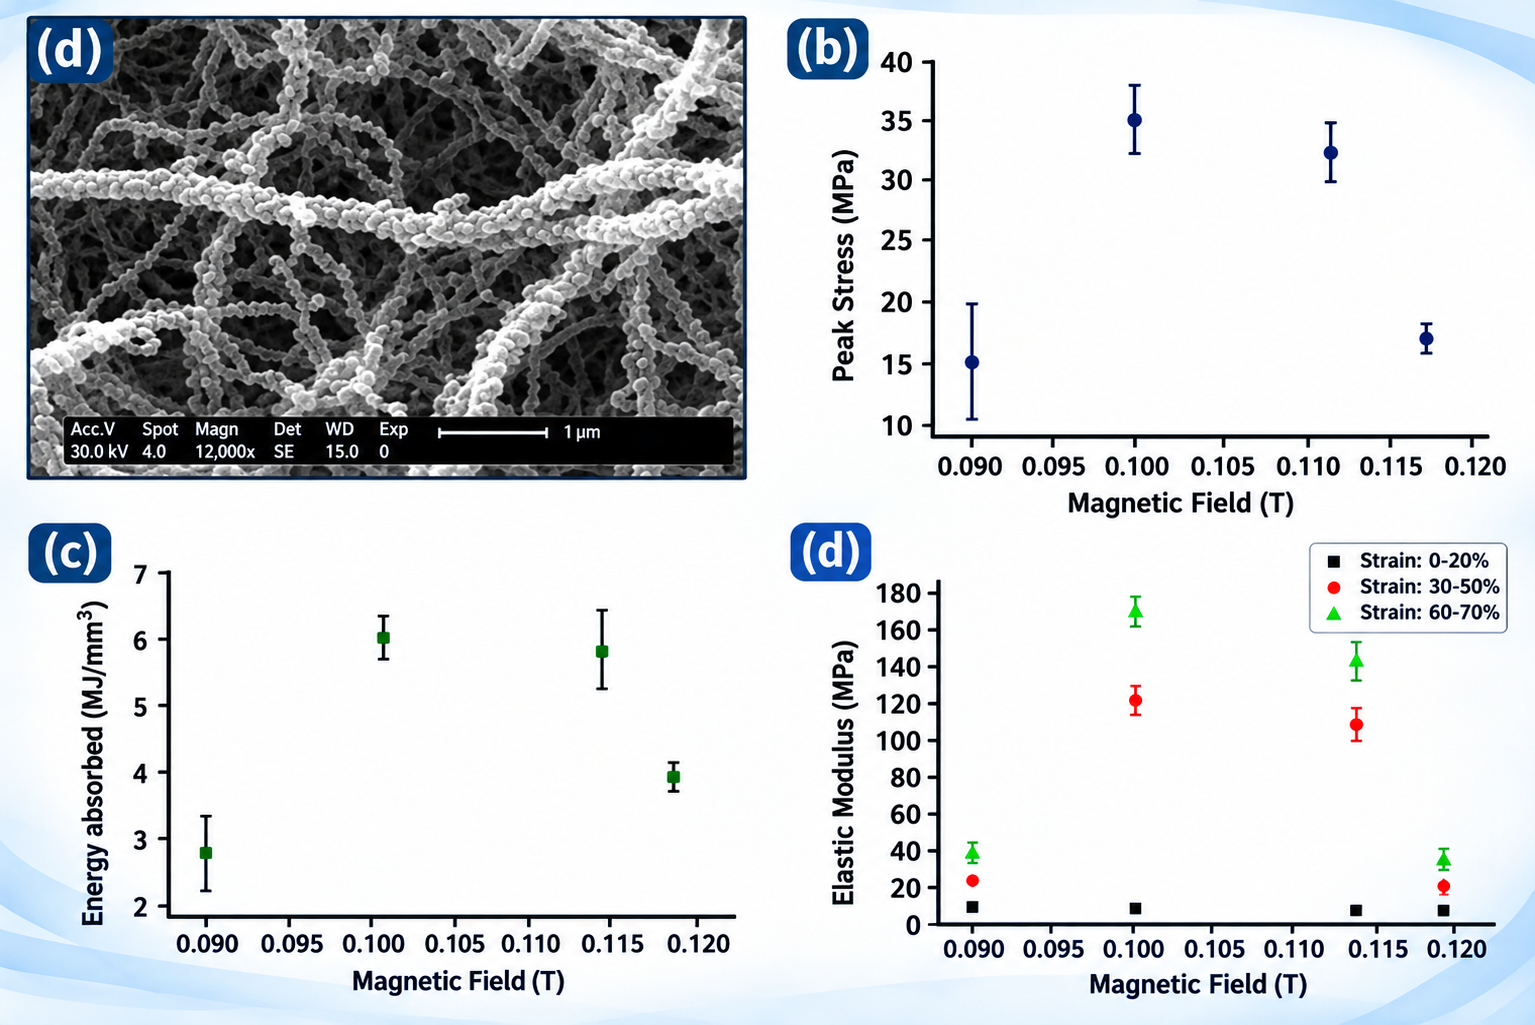
Influence of Magnetic field on the compressive behavior of carbon nanotubes
Figure: High resolution images that show the nanoparticles adhered to the surfaces of CNT. Peak stress is plotted with the magnetic field intensities. Energy absorption is plotted with the magnetic field intensities. Elastic modulus in three regions of strains is plotted with the magnetic field intensities.
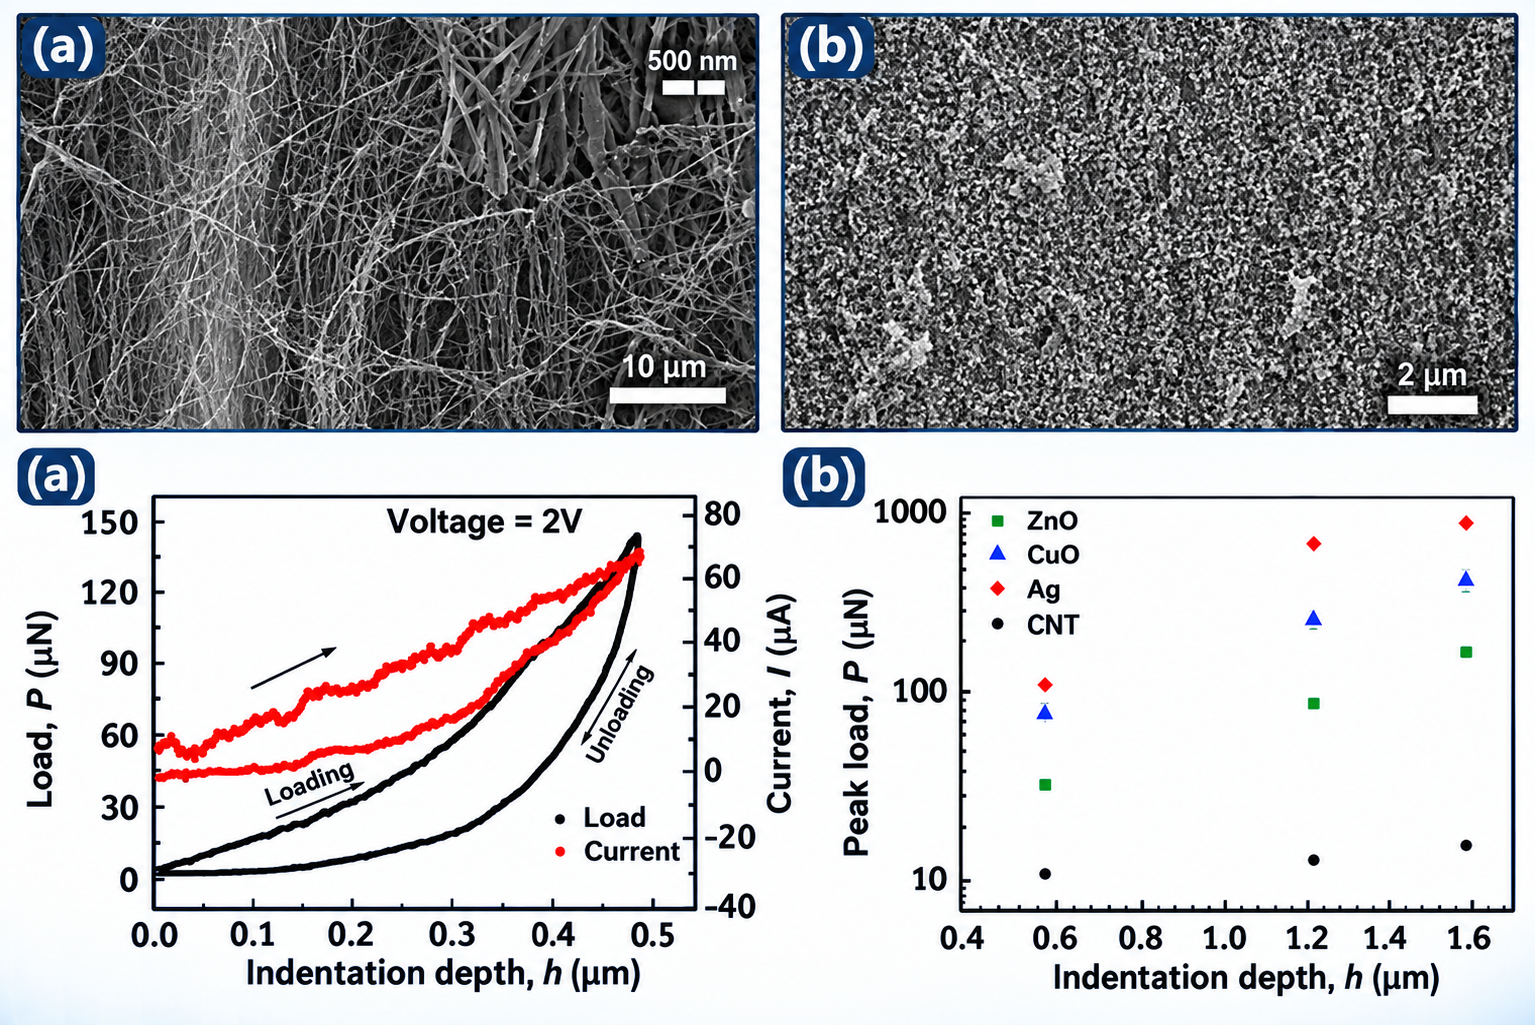
Tuning of the electro-mechanical behavior of the cellular carbon nanotube structures with nanoparticle dispersions
Figure: Scanning electron micrographs of the cellular CNT mat (a) before (inset shows a high resolution entangled CNT microstructure) and (b) after dispersion of nanoparticles. (a) Representative plots of load, P, and current, I, vs. depth of penetration, h, for Ag nanoparticle dispersed CNT structure from at maximum indentation depths of 0.5. (b) Measured values of the maximum loads, Pmax, as a function of the applied maximum depths of penetration, hmax, for all mats with different nanoparticles dispersions.
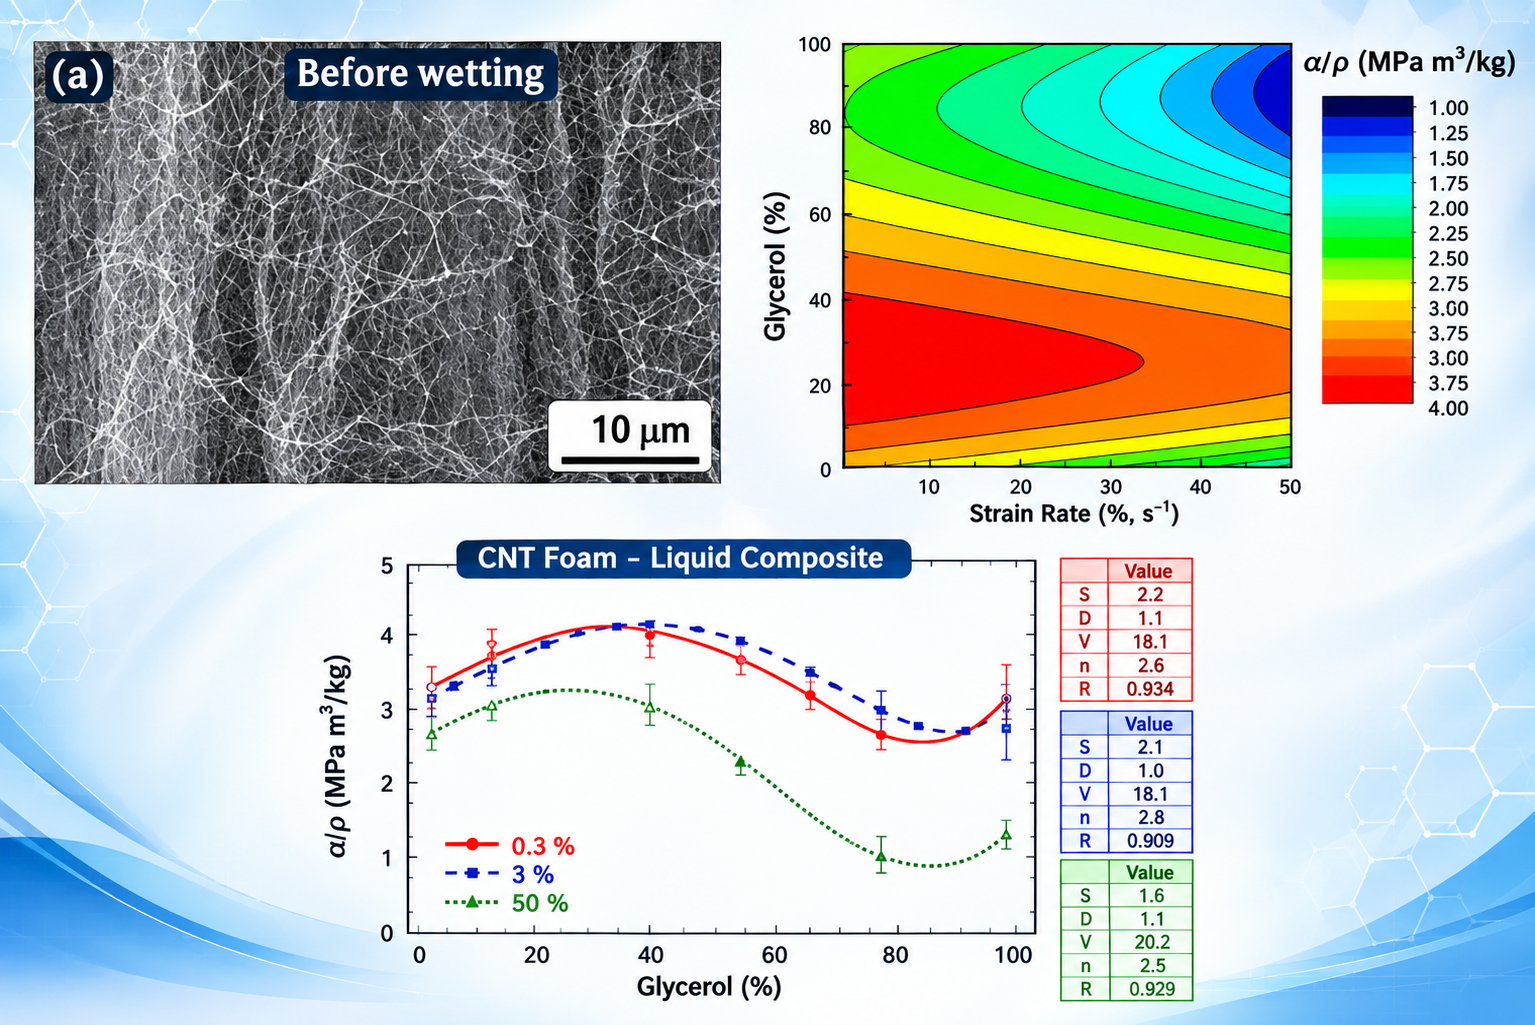
Effect of fluid medium on mechanical behavior of carbon nanotube foam of fluid medium on mechanical behavior of carbon nanotube foam
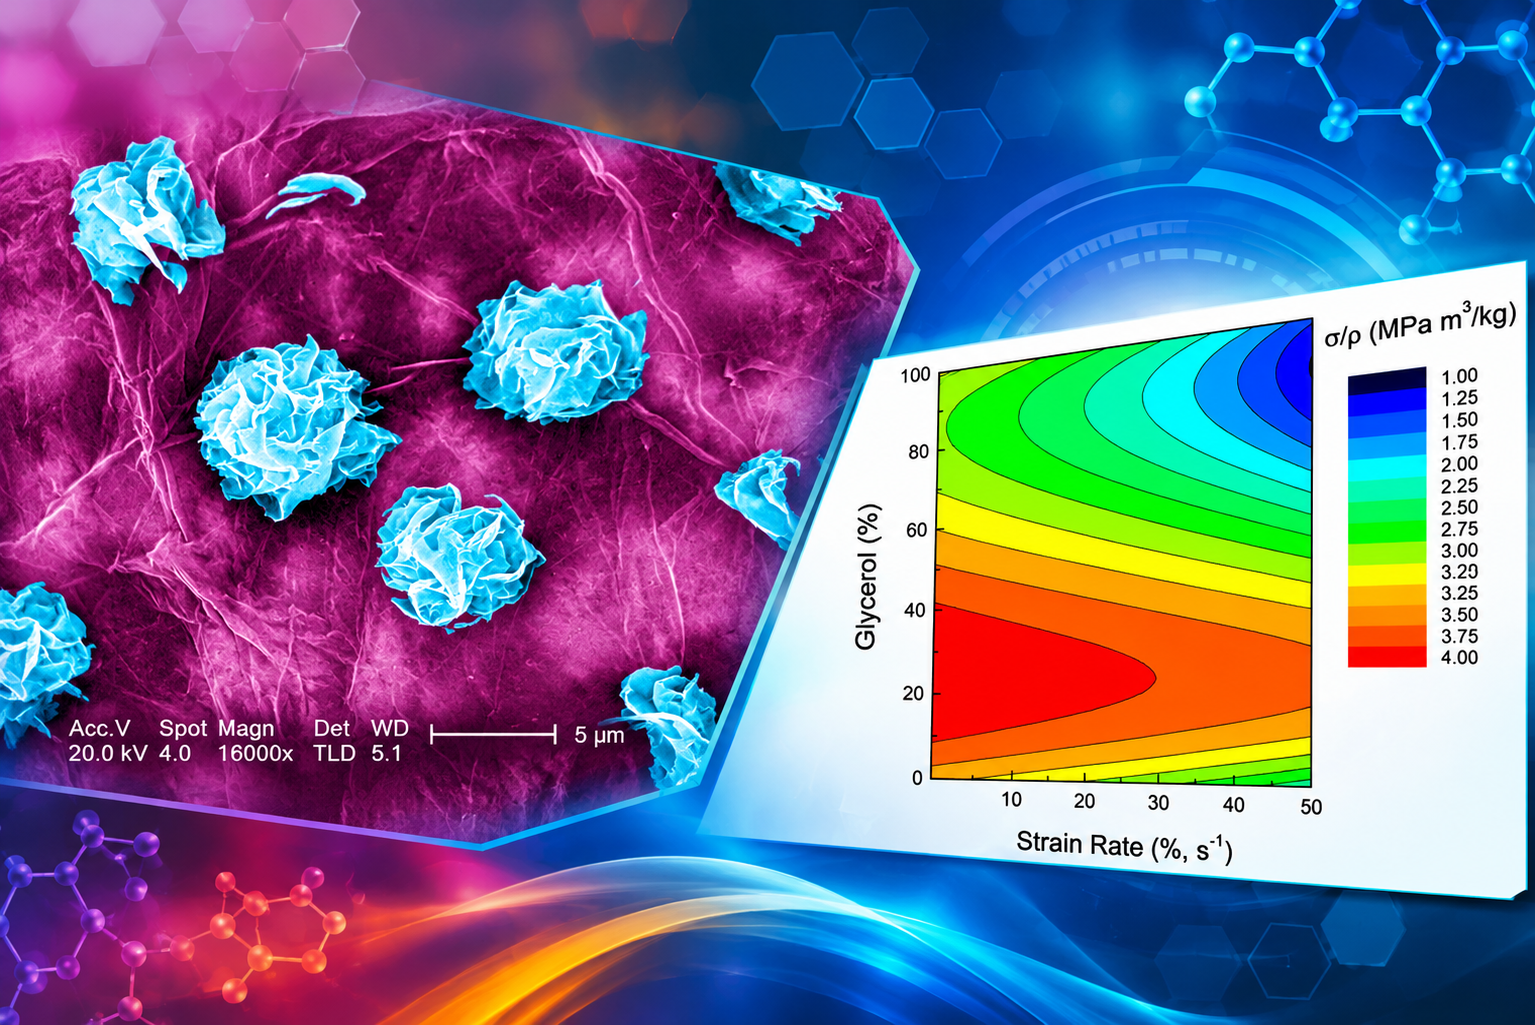
Figure: Representative SEM micrograph of the as-grown, dry CNT foam sample. Contour plot showing the variation of normalized stress at a strain of 50% as a function of the strain rate and the glycerol concentration in the water-glycerol solution. The stress was normalized dividing it by the density of the as-grown, dry CNT foam. Best-fit curve analysis of the experimental data. The tables on the right show the values of various constants calculated from the curve fit analysis at different strain rates.
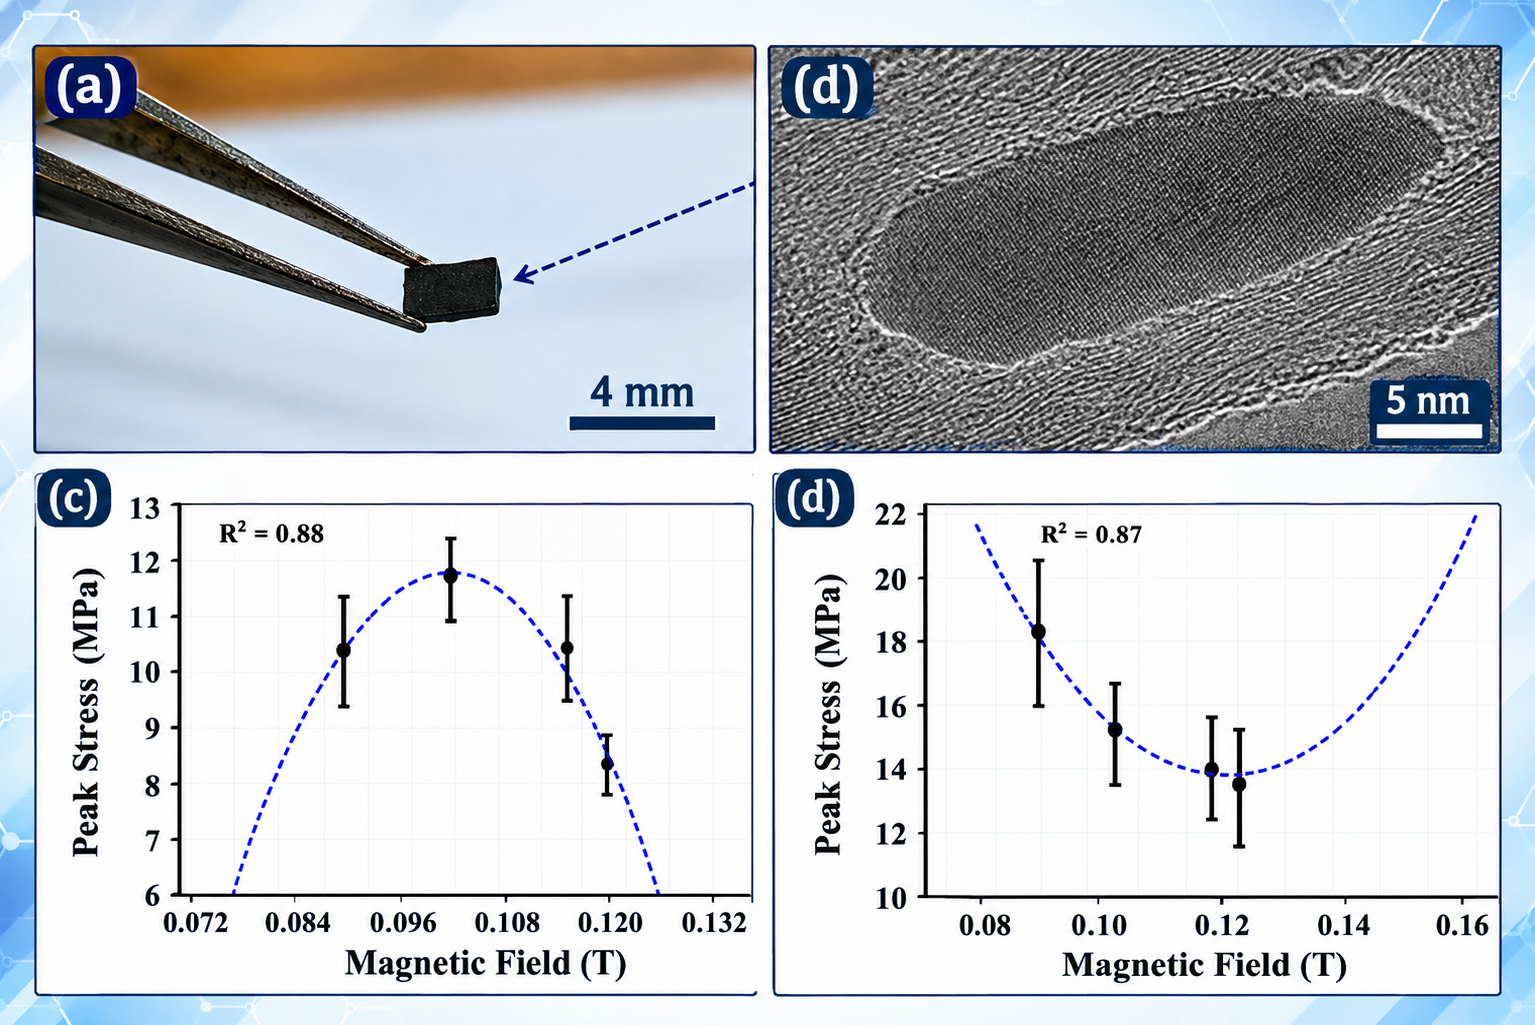
Magnetic field induced tailoring of mechanical behavior of fluid filled micro porous carbon nanotube foam
Figure: Optical image of the CNT Foam. A high-resolution TEM image of partially iron filled inside the core of CNT. Peak stresses are plotted with the applied magnetic field for CNT mats that are impregnated with 90% glycerol, and silicon oil.
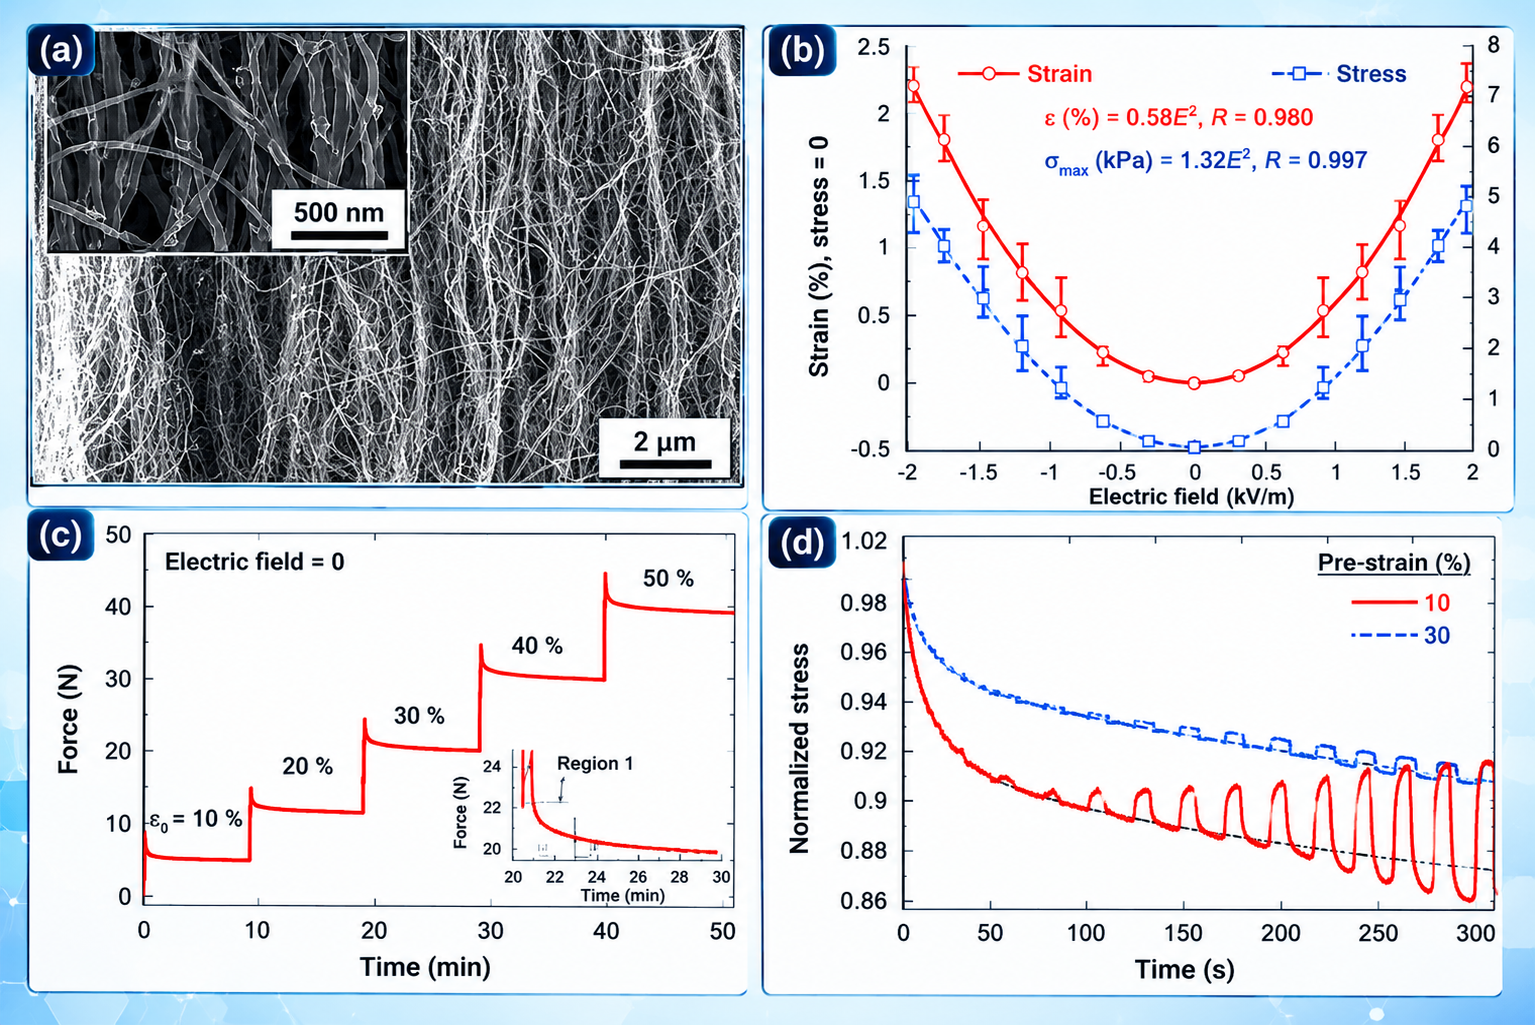
Tailoring viscoelastic response of carbon nanotubes cellular structure using electric field
Figure: Representative SEM micrographs showing the configuration of CNT bundles and individual CNT strands in the cellular CNT samples used in this study. Variation of the electric field induced strain in the unstressed freestanding CNT sample and the additional stress that needs to be applied onto the sample to maintain zero macroscopic strain as a function of the electric field. R is the curve fitting parameter. The stress relaxation as registered in a representative CNT sample compressed to various pre-compressive strains with no electric field. Variation of the normalized stress as a function of the time after application of the “instantaneous” pre-compressive strain. The pulse voltage increased by 0.02 V in the sequence of 0.07, 0.09, 1.1, etc. The dotted line represents stress relaxation if electric field was not applied.
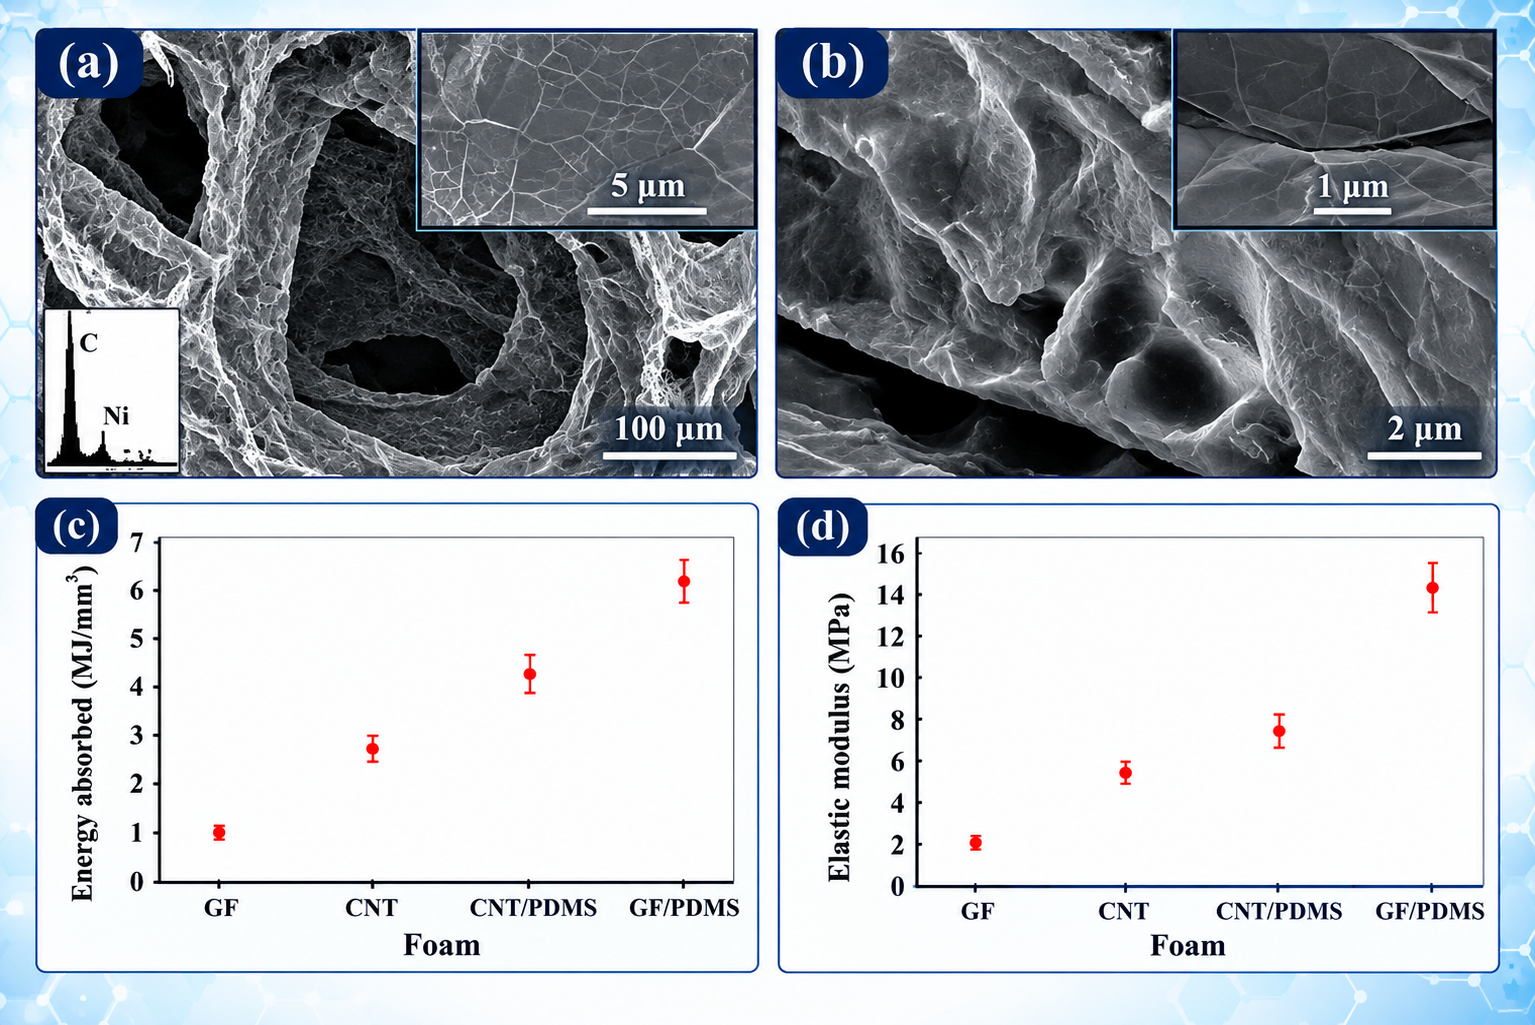
Highly compressible behavior of polymer mediated three-dimensional network of graphene foam
Figure: SEM images showing the microstructure: (a) three-dimensional GF networks; (b) GF/PDMS composite. Comparisons of mechanical properties of GF, CNT, CNT/PDMS, and GF/PDMS foams: energy absorption and elastic modulus.
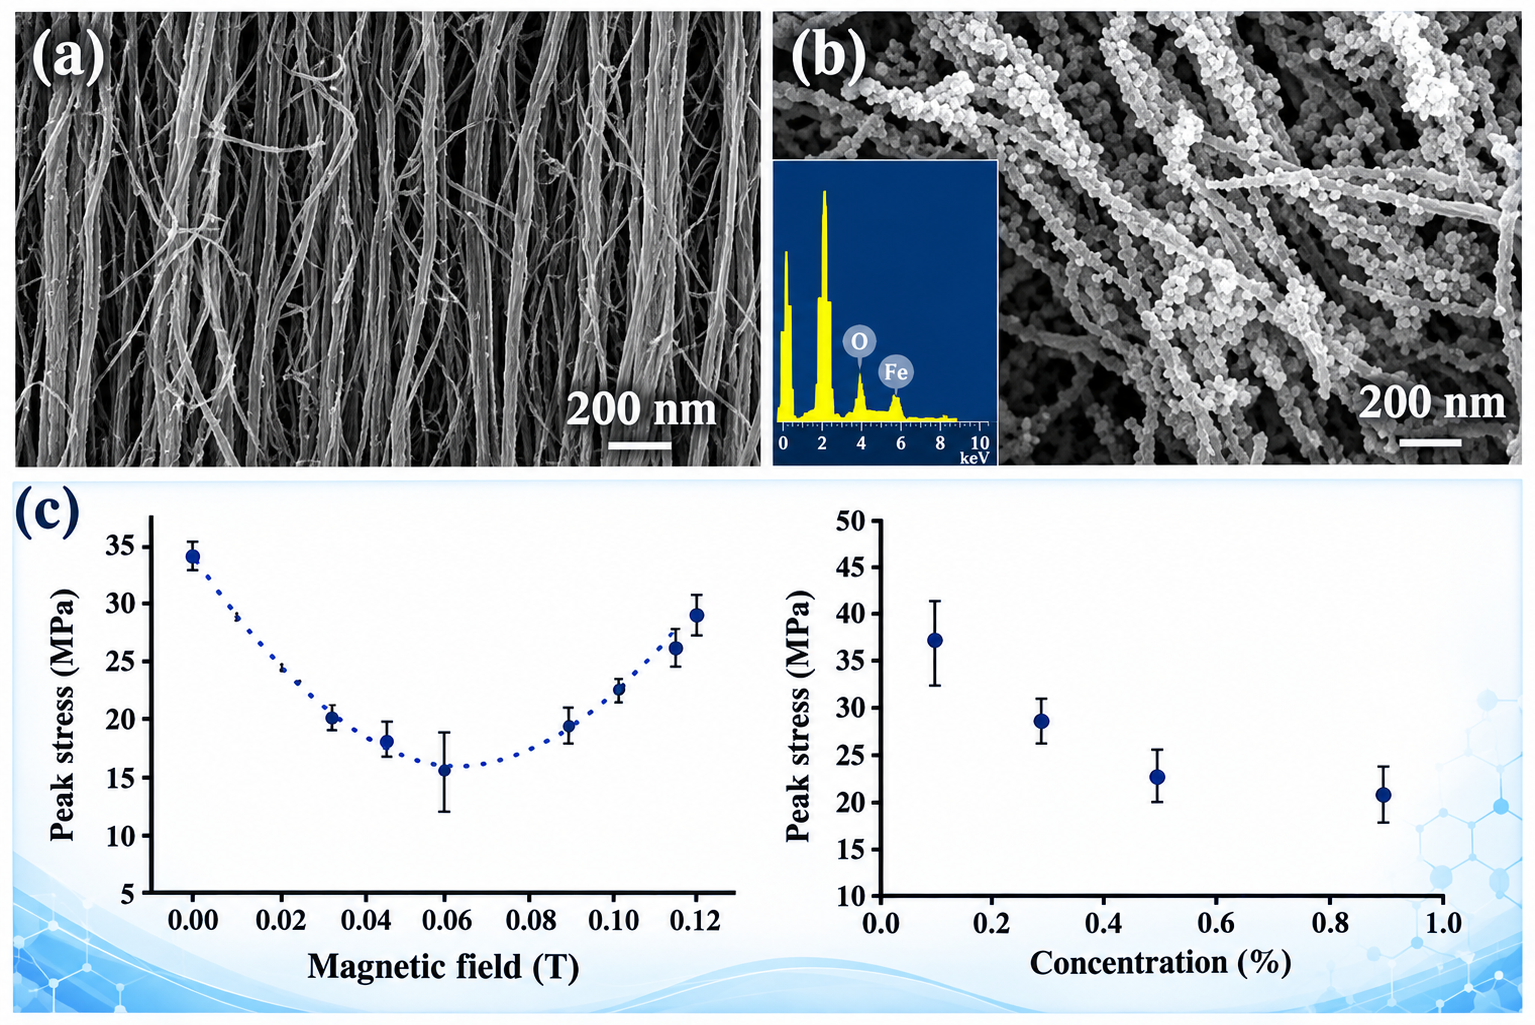
Tailored mechanical behavior of magnetic particles loaded carbon nanotube foam in presence of magnetic field
Figure: SEM images of (a) pristine CNT foam and (b) CNT decorated with iron oxide nanoparticles. Peak stress capability with increasing magnetic field intensity. Peak stress variation with the varying concentration of iron oxide nanoparticles loaded in the CNT foam in the presence of a magnetic field intensity of 0.12 T.
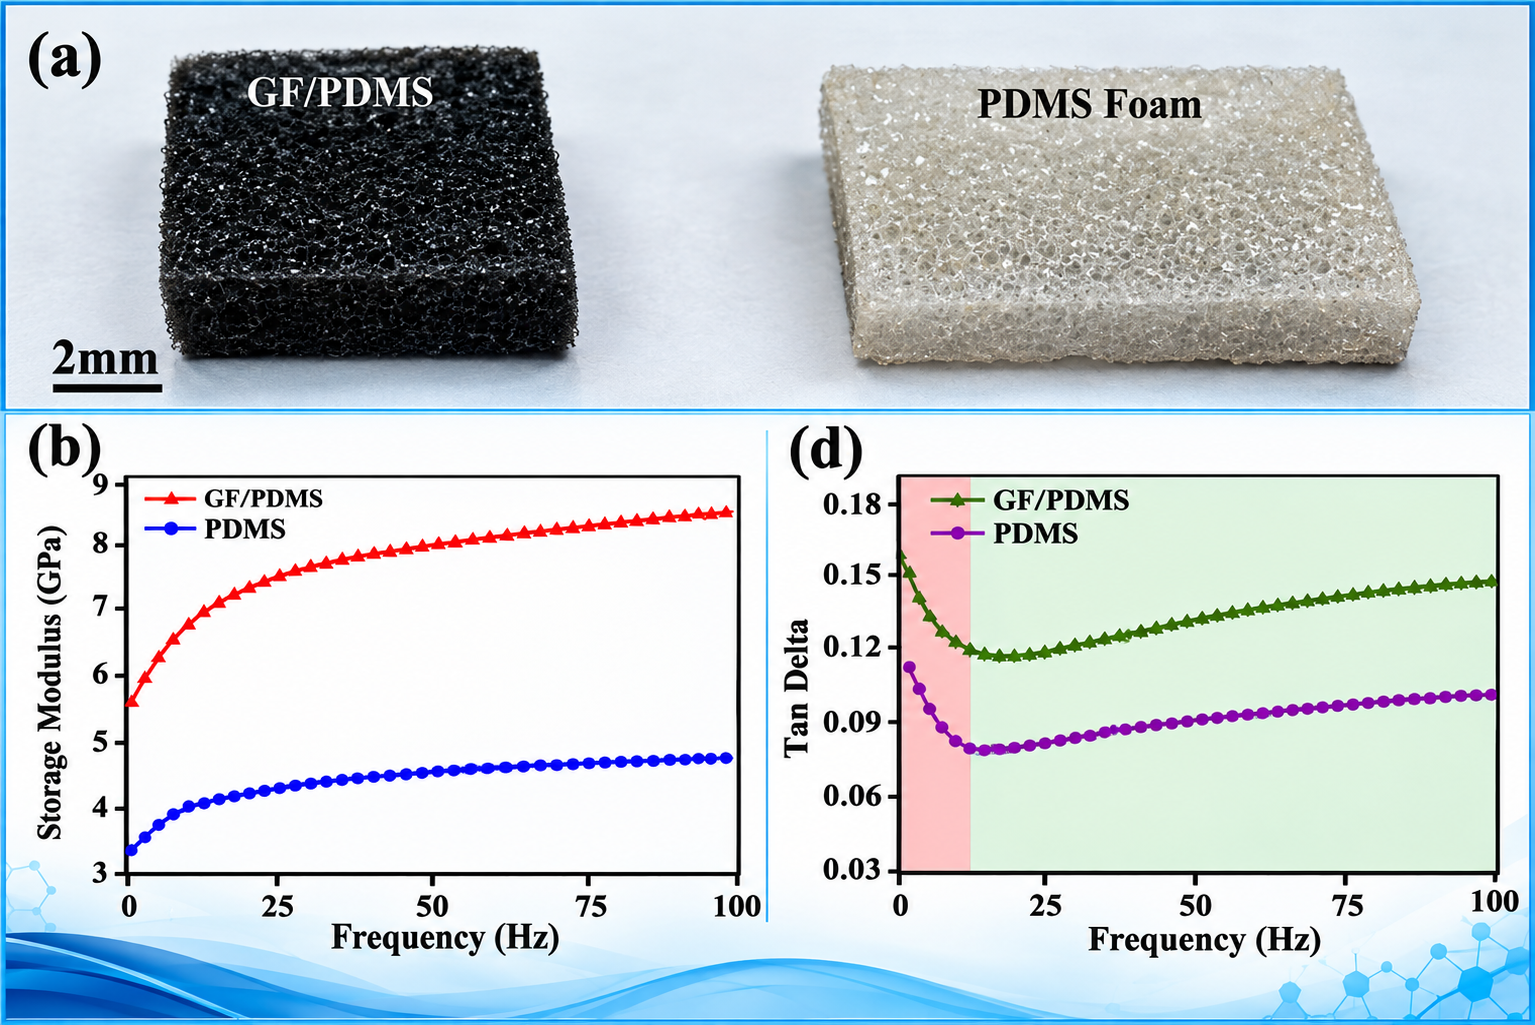
Temperature dependent compressive behavior of graphene mediated three-dimensional cellular assembly
Figure: Optical image of porous GF/PDMS (black) and PDMS foam (white). Storage modulus and tan delta as a function of frequency in glassy state GF/PDMS and PDMS foams.
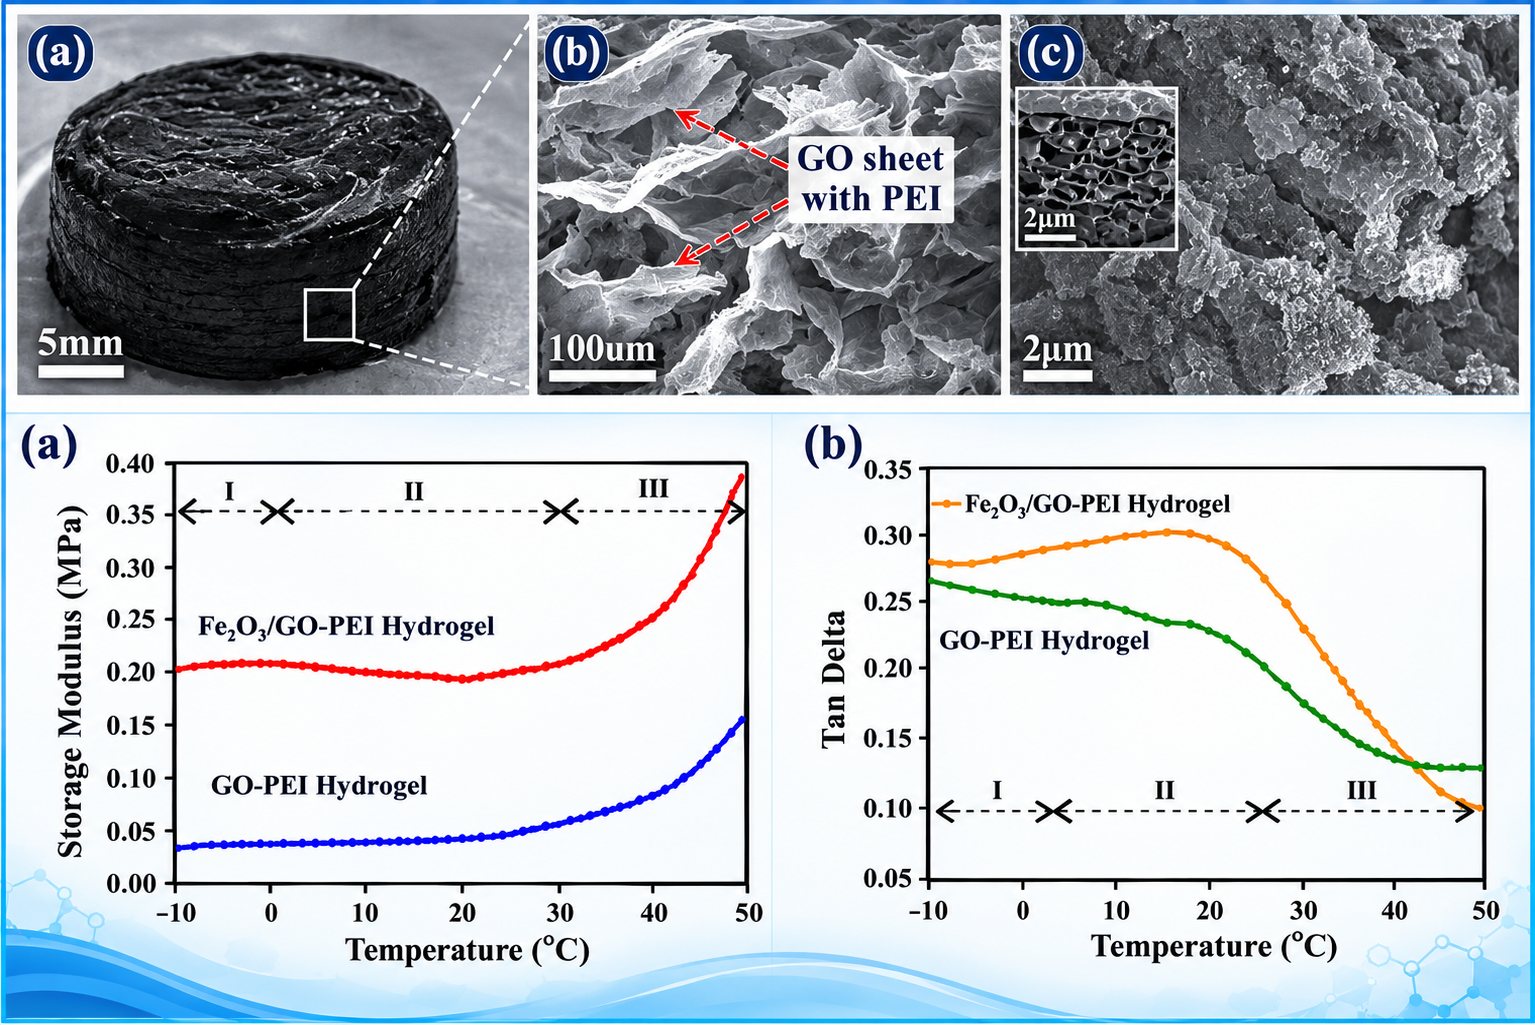
Thermo-mechanical behavior of graphene oxide hydrogel
Figure: (a) Optical image of GO-PEI hydrogel. Microstructure of (b) GO-PEI and (c) Fe2O3/GO-PEI hydrogels, inset depicts the schematic diagram of the sample. Storage modulus and (b) tan delta of GO-PEI and Fe2O3/GO-PEI hydrogels in water as a function of temperature.